Seasonality in Futures Markets: Does It Actually Hold Up, or Is It Noise
Open any futures broker's research tab in October and you'll see a seasonality chart for natural gas showing a reliable winter rally, or one for corn promising a harvest-time dip. These charts look authoritative — clean lines, 10 or 15 years of data, a shaded "seasonal window." What they almost never show you is the spread around that average line, and that spread is usually the whole story. A seasonal pattern built from 15 observations isn't a law of markets. It's a coin that's landed heads 9 times out of 15, and a lot of retail seasonality content treats that like a loaded coin.
The Sample Size Problem Nobody Puts on the Chart
Standard error shrinks with the square root of sample size, not linearly. Fifteen or twenty years of seasonal data for a single calendar window is a small sample in any statistical sense — it's barely enough to say anything with real confidence about a pattern that only occurs once a year. One quantitative research shop that re-tested twenty popular seasonal windows across five major indices found that roughly a third of them collapsed once they looked past the average line: for twelve of the twenty windows checked, the implied "edge" sat entirely inside the statistical noise band. That doesn't mean seasonality is fake. It means most of the seasonality charts marketed to retail traders are presenting noise with a confident-looking trend line drawn through it, and the eye reads a smooth average as "this happens most years" when the underlying data might have ranged from +9% to -6% depending on the year you picked.
The honest version of a seasonality chart shows you the distribution, not just the mean: how many of the 15-20 years were actually positive, what the worst year looked like, and whether the pattern held in both calm and volatile regimes. If a seasonal window is positive in 11 of 15 years but the 4 losing years include a loss larger than the sum of the winning years, the "average positive return" is misleading you. Check the win rate and the max drawdown within the window before you check the average.
Where Seasonality Has a Real Fundamental Driver
Not all seasonality is p-hacked noise. Some patterns exist because of genuine, recurring, physical supply-and-demand cycles, and those are worth distinguishing from pure calendar pattern-matching:
- Natural gas (NG): Winter heating demand and the injection/withdrawal cycle in underground storage create a real seasonal structure. CME Group's own 15-year seasonality analysis on front-month natural gas shows October and November mark the end of the historically positive months, with prices typically drifting lower heading into Q1 as the market front-runs the withdrawal season and then faces the reality of how much gas is actually in storage. This is driven by an auditable, physical mechanism — EIA storage reports every Thursday — not just calendar coincidence.
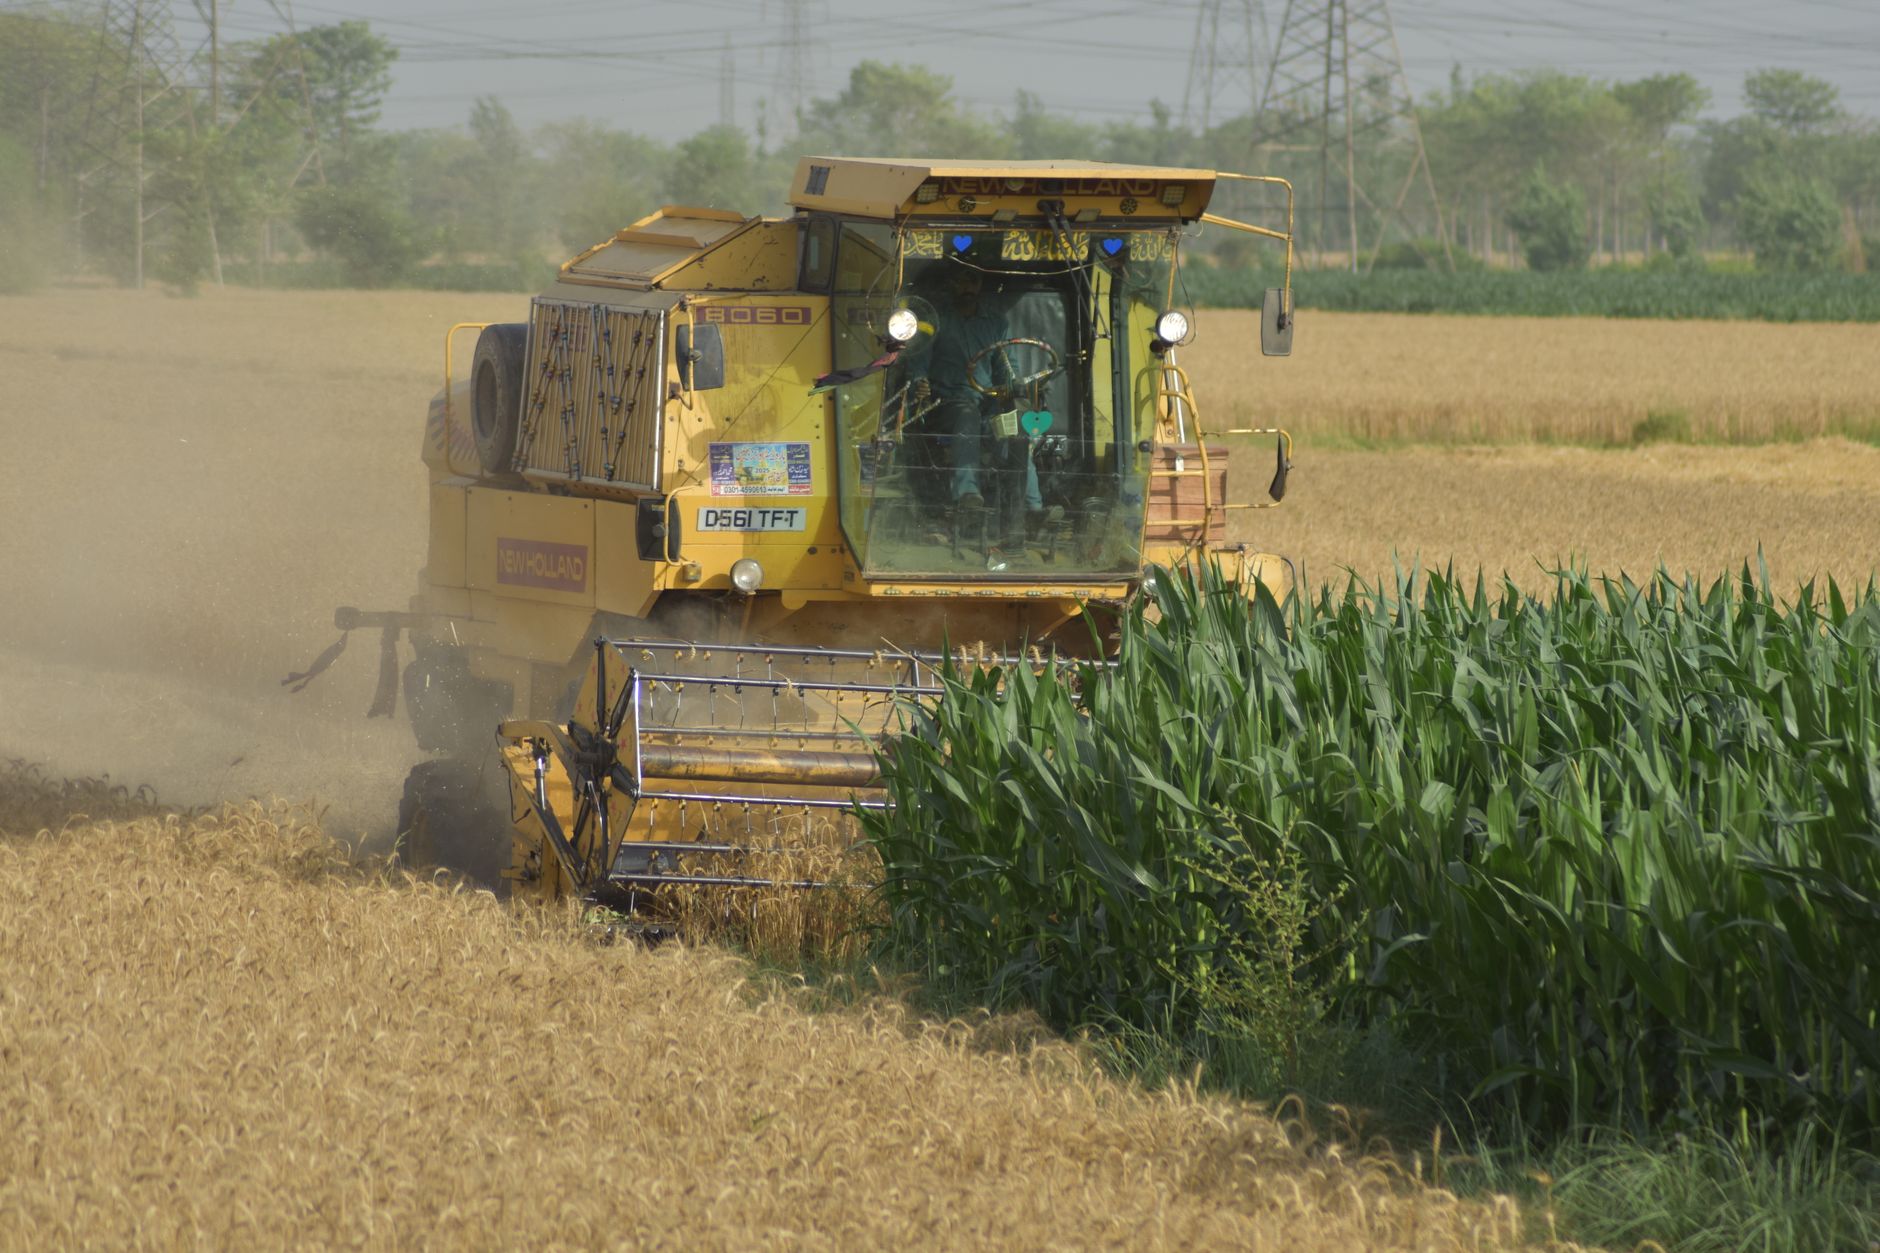
- Corn (ZC): December corn futures have a documented tendency to set their contract-year high in the May-July window rather than at harvest, when supply uncertainty (planting weather, early-season yield risk) is at its peak before the crop is actually in the bin. One long-running analysis going back to 1990 found the delivery-year high for December corn fell in May or June in roughly 17 of 20 years, with harvest-time lows far more common once the crop uncertainty resolves into a known, large supply. That's a story about information resolution, not magic calendar dates.
- Crude oil (CL): Driving season demand (summer) and refinery maintenance turnarounds (spring and fall) create a loosely recurring seasonal shape in crack spreads and, to a lesser extent, outright price, though this one is far noisier and more overwhelmed by macro and geopolitical shocks than NG or grains.
- Lean hogs (HE): Hog futures carry one of the more mechanical seasonal cycles in the entire futures space, because it's anchored to a biologically fixed gestation and finishing period, not weather or sentiment. Supply tightens into early summer as herd numbers cycle down from the prior year's breeding decisions, then loosens again as fall-finished hogs hit the market around the holiday demand window — a cycle you can sanity-check against USDA Hogs and Pigs reports rather than just the price chart.
The common thread: these seasonal effects survive scrutiny because there's an independent, physical explanation you can check against separate data (storage levels, planting progress, refinery utilization, breeding-herd reports) — not just "the price went up in this window historically." That's also the practical test for whether a seasonal pattern deserves to shape your directional bias at all: can you name the physical mechanism, or are you just staring at a backtested average?
The Equity Seasonality That Actually Replicates: Sell in May
If you want an example of a seasonal effect that has actually been stress-tested at scale, it's the "Sell in May and Go Away" (Halloween) effect in equities. A 2020 academic study re-examined it using all available historical data across 65 countries (over 60,000 observations) rather than cherry-picked markets or time windows, and found November-April returns were on average about 4 percentage points higher than May-October returns, with the effect holding in the large majority of countries tested and summer excess returns frequently negative. That's a seasonal claim backed by a sample size orders of magnitude larger than what you get from 15 years of a single futures contract. It's also still only a few percentage points of average outperformance over six months — not a strategy you lever up and forget, and transaction costs plus tax drag will eat into it for anyone trading it directly rather than holding through it.
What Overfitting Looks Like in Seasonality Research
The retail seasonality tools most traders use let you scan "best 30-day window of the year" across every contract and every start date, then show you the single best-looking result. That's a multiple comparisons problem dressed up as research. If you test 365 possible start dates across a 20-year history, you will find windows with an 85%+ historical win rate purely by chance — that's what happens when you run enough independent trials. Academic work using more rigorous methods, like dummy-variable regression and singular spectrum analysis across dozens of commodity futures, explicitly separates a transparent calendar-effect test (did returns in month X differ significantly from the rest of the year) from a flexible, data-mined pattern search, and the two approaches do not always agree on which months matter. The honest takeaway from that research: seasonal effects in commodities vary meaningfully by market and by the specific statistical method used to find them, and no single seasonality indicator reliably "works" for every commodity the way retail marketing implies.
How to Actually Use Seasonality If You Trade Futures
Treat seasonality as one input that adjusts your bias and position sizing, not a standalone signal you trade blind:
- Check the win rate, not just the average. A window that's positive 60% of the time with a tight loss distribution is more tradeable than one that's positive 55% of the time but has one catastrophic losing year that would have wiped out the gains from the other nineteen.
- Demand a fundamental mechanism. If you can't point to storage data, planting calendars, or a recurring demand cycle that explains the pattern, treat it as coincidence until proven otherwise. Professional desks call this a fundamental overlay: the seasonal window only gets traded when current storage, planting progress, or herd data actually agrees with the historical bias — not on the calendar date alone.
- Check term structure before you trust the calendar. A seasonal long bias means a lot less if the futures curve is in steep contango and you're bleeding roll yield every month you hold the position. Backwardation that aligns with a bullish seasonal window is a much stronger setup than the same seasonal bias fighting an unfavorable curve.
- Size it smaller than a backtested "edge" implies, and define entry, stop, and target mechanics before the window opens — not after you're already in the trade reacting to price. Seasonality windows rarely survive full position-sized trading in live markets because of the small sample problem; use it to tilt an existing thesis with a pre-defined risk level, not to generate a trade from nothing.
- Re-test out of sample. If a pattern held in years 1-15 of your dataset, check whether it also held in years 16-20 before trusting it going forward. Most data-mined seasonal "edges" degrade sharply the moment you add fresh out-of-sample years.
Seasonality in futures is real in specific, fundamentally-anchored cases — natural gas storage cycles and grain harvest uncertainty being the clearest examples — and mostly noise everywhere a chart is generated by scanning for the best-looking historical window. The difference between the two isn't visible in the pretty average-return line most brokers show you. It's visible in the win rate, the worst-case year, and whether there's a physical reason the pattern should exist at all.